.avif)
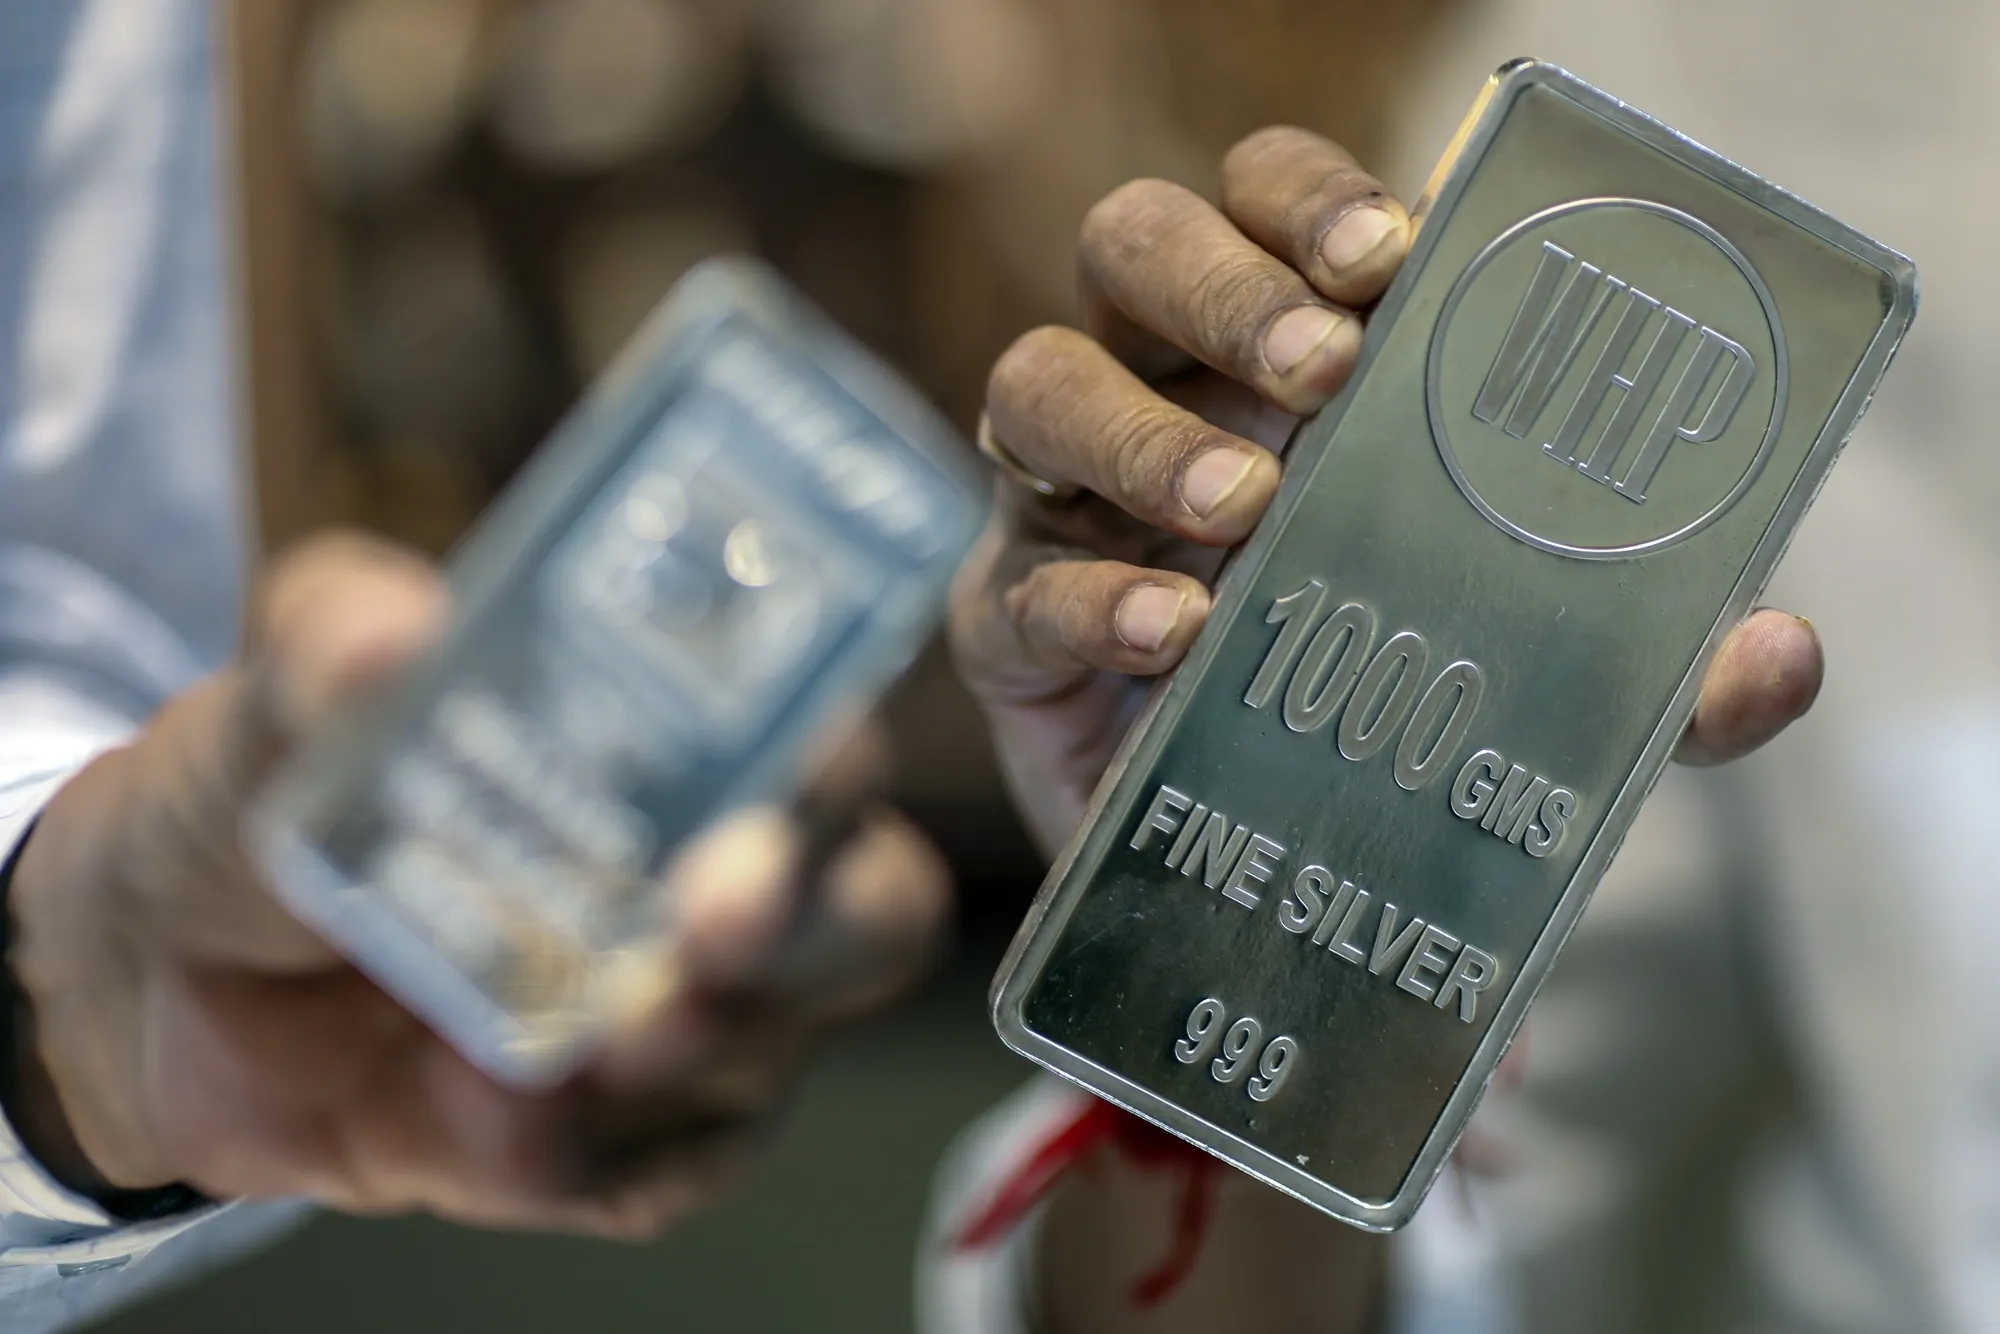
Gold futures fell 1.21% to $4,821 per ounce on COMEX Friday, even as US Navy forces fired on and seized an Iranian-flagged cargo ship attempting to bypass the naval blockade in the Gulf of Oman. The counterintuitive move reflects a fundamental shift in how precious metals respond to geopolitical shocks in 2026's inflationary environment. Where previous crises triggered safe-haven buying, this energy disruption amplified Federal Reserve rate hike expectations, creating forced liquidation among leveraged gold positions. WTI crude jumped to $86.25/bbl, while silver dropped 2.05% to $80.16 per ounce, confirming broad precious metals selling pressure.
The margin anatomy reveals where the squeeze concentrates. A typical leveraged gold trader holding 100 contracts (equivalent to 10,000 ounces) on 10:1 leverage faces roughly $70,000 in mark-to-market losses on Friday's 1.2% decline alone. With initial margin requirements around $8,000 per contract, that same trader needs $800,000 in capital backing their position. The $70,000 daily loss represents nearly 9% of their margin requirement in a single session. When oil spiked above $90/bbl — signaling persistent inflation rather than temporary disruption — algorithms and systematic funds began unwinding precious metals longs to meet margin calls. This forced selling accelerated as stop-loss orders clustered around the $4,850 level triggered in sequence.
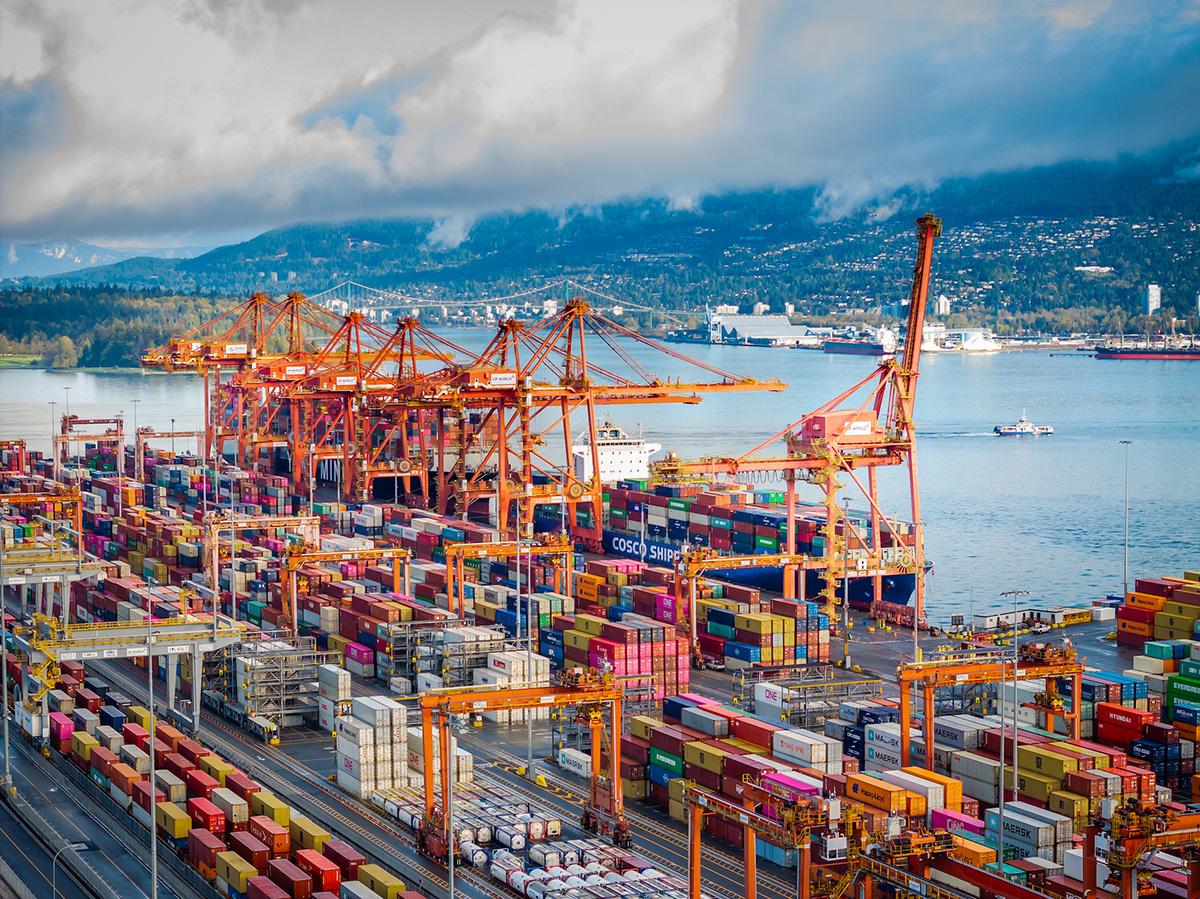
The Strait of Hormuz — 34 kilometres wide at its narrowest point — facilitates the transit of around 20 million barrels of oil per day, representing roughly 20% of global seaborne oil trade. According to President Trump, US forces took custody of an Iranian-flagged cargo ship after firing on its engine room, while maritime authorities reported gunfire involving Iranian gunboats and merchant vessels attempting to cross the waterway. The physical disruption sent Brent crude futures above $94/bbl in early trading, with freight rates for VLCCs (Very Large Crude Carriers) — supertankers capable of carrying 2 million barrels — jumping 40% overnight as operators demanded war-risk premiums. Each percentage point increase in oil prices translates to roughly $28 billion in additional annual energy costs for the global economy.
On the buy side, institutional precious metals funds faced redemption pressure as energy-exposed allocators rotated capital toward oil and gas equities. The $26 billion California Public Employees' Retirement System (CalPERS) — a major gold ETF holder — received instructions to reduce precious metals exposure by $400 million through month-end to fund increased energy infrastructure allocations. Smaller regional pension funds and endowments, lacking derivatives access to hedge their gold positions, resorted to outright sales rather than sophisticated collar strategies. University endowments managing $10-50 billion in assets typically hold 3-5% precious metals allocations; a 20% reduction across this segment represents roughly $2-4 billion in potential selling pressure.
On the sell side, precious metals mining companies paradoxically benefit from the margin compression among financial holders. Newmont Corporation and Barrick Gold — the world's largest gold producers — generate approximately $1,200-1,400/oz in all-in sustaining costs, meaning current prices around $4,821/oz still deliver robust operating margins exceeding 70%. However, these miners face their own margin pressure as diesel fuel costs — critical for mining operations — surge alongside crude oil. A $10/bbl increase in oil translates to roughly $15-20/oz in additional production costs for major gold miners, partially offsetting the windfall from sustained high gold prices. Regional gold refiners in Switzerland and Dubai, processing raw material from Africa and Asia, report three-week delays in securing transportation as shipping companies demand 200-300% premiums for Persian Gulf routes.
For large integrated traders with derivatives access — Goldman Sachs Principal Strategic Investments, JPMorgan's commodities desk, Trafigura's metals division — the relationship inversion creates arbitrage opportunities rather than margin calls. A sophisticated desk might simultaneously short gold futures while buying oil, capturing the spread widening as energy concerns overwhelm safe-haven demand. The gold-oil ratio — currently around 54 (meaning 54 ounces of gold buy one barrel of oil) — traded as high as 87 in March 2020 during the COVID crisis. Each point of ratio compression generates roughly $90 profit per paired contract for traders positioned correctly. These players can also sell volatility in gold options while buying it in crude, profiting from the volatility term structure inversion.
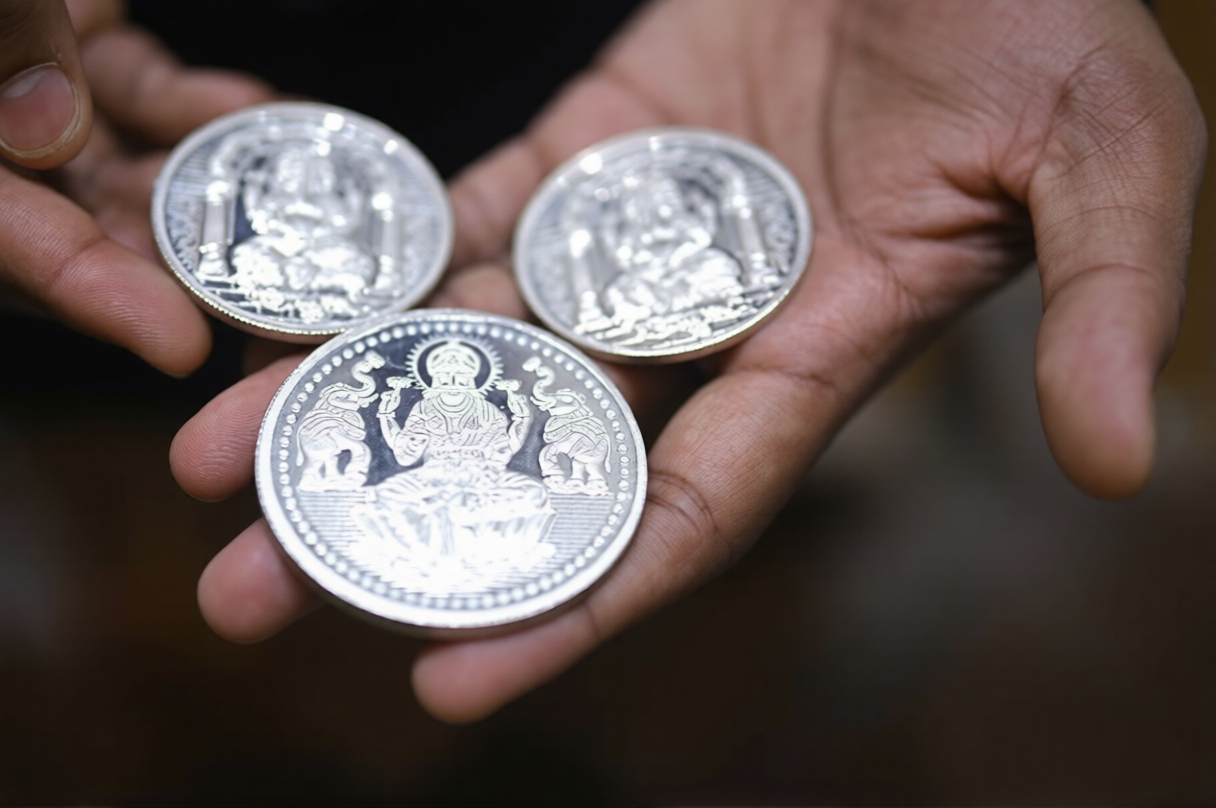
For smaller regional operators — independent coin dealers, regional bullion distributors, family offices managing $100-500 million — the crisis demands more defensive positioning. Unable to access complex derivatives, these operators hedge by diversifying supplier relationships and adjusting inventory turnover. A mid-sized precious metals dealer might reduce gold inventory from 90 days to 45 days of sales coverage, converting excess physical holdings to cash to avoid further mark-to-market losses. Regional coin shops report 30-40% declines in retail buying interest as consumers postpone purchases expecting lower prices. These operators often maintain relationships with 5-7 wholesale suppliers; diversification becomes critical when Swiss refiners quote 3-week delays and South African suppliers demand 200% freight premiums.
The Federal Reserve's positioning intensifies the pressure on precious metals. Fed officials signal potential rate hikes if energy-driven inflation persists, with Chair Powell's successor Kevin Warsh considered more hawkish than expected. The Fed's Summary of Economic Projections still projects at least one quarter-point rate cut in 2026, but energy analysts calculate that sustained $90+ oil requires 50-75 basis points of additional tightening to contain inflation expectations. Each 25 basis point Fed rate increase typically correlates with $120-150/oz declines in gold prices, as higher yields increase the opportunity cost of holding non-yielding assets. Powell noted that "near-term measures of inflation expectations have risen in recent weeks, likely reflecting the substantial rise in oil prices caused by supply disruptions in the Middle East".
For observers, the critical signal emerges from the gold-oil correlation coefficient, which inverted from +0.3 (mild positive correlation) to -0.6 (strong negative correlation) within 72 hours of the Hormuz escalation. This technical breakdown suggests traditional safe-haven relationships remain suspended as long as energy disruptions persist. Reports indicate Trump expressed willingness to end the Iran confrontation even without fully restoring Hormuz navigation, but shipping markets require 7-10 days minimum to normalize after any resolution. The next inflection point arrives with Wednesday's US crude oil inventory data from the Energy Information Administration — typically released at 10:30 AM ET. A build of more than 2 million barrels would signal demand destruction from high prices, potentially easing Fed tightening fears and allowing precious metals to recover safe-haven demand.


'%3e%3cg id='Final-Copy-2_2_' transform='translate(1275.000000, 200.000000)'%3e%3cpath class='st0' d='M7.4,12.8h6.8l3.1-11.6H7.4C4.2,1.2,1.6,3.8,1.6,7S4.2,12.8,7.4,12.8z'/%3e%3c/g%3e%3c/g%3e%3c/g%3e%3cg id='final---dec.11-2020'%3e%3cg id='_x30_208-our-toggle' transform='translate(-1275.000000, -200.000000)'%3e%3cg id='Final-Copy-2' transform='translate(1275.000000, 200.000000)'%3e%3cpath class='st1' d='M22.6,0H7.4c-3.9,0-7,3.1-7,7s3.1,7,7,7h15.2c3.9,0,7-3.1,7-7S26.4,0,22.6,0z M1.6,7c0-3.2,2.6-5.8,5.8-5.8 h9.9l-3.1,11.6H7.4C4.2,12.8,1.6,10.2,1.6,7z'/%3e%3cpath id='x' class='st2' d='M24.6,4c0.2,0.2,0.2,0.6,0,0.8l0,0L22.5,7l2.2,2.2c0.2,0.2,0.2,0.6,0,0.8c-0.2,0.2-0.6,0.2-0.8,0 l0,0l-2.2-2.2L19.5,10c-0.2,0.2-0.6,0.2-0.8,0c-0.2-0.2-0.2-0.6,0-0.8l0,0L20.8,7l-2.2-2.2c-0.2-0.2-0.2-0.6,0-0.8 c0.2-0.2,0.6-0.2,0.8,0l0,0l2.2,2.2L23.8,4C24,3.8,24.4,3.8,24.6,4z'/%3e%3cpath id='y' class='st3' d='M12.7,4.1c0.2,0.2,0.3,0.6,0.1,0.8l0,0L8.6,9.8C8.5,9.9,8.4,10,8.3,10c-0.2,0.1-0.5,0.1-0.7-0.1l0,0 L5.4,7.7c-0.2-0.2-0.2-0.6,0-0.8c0.2-0.2,0.6-0.2,0.8,0l0,0L8,8.6l3.8-4.5C12,3.9,12.4,3.9,12.7,4.1z'/%3e%3c/g%3e%3c/g%3e%3c/g%3e%3c/g%3e%3c/svg%3e) Privacy Choices
Privacy Choices