.avif)
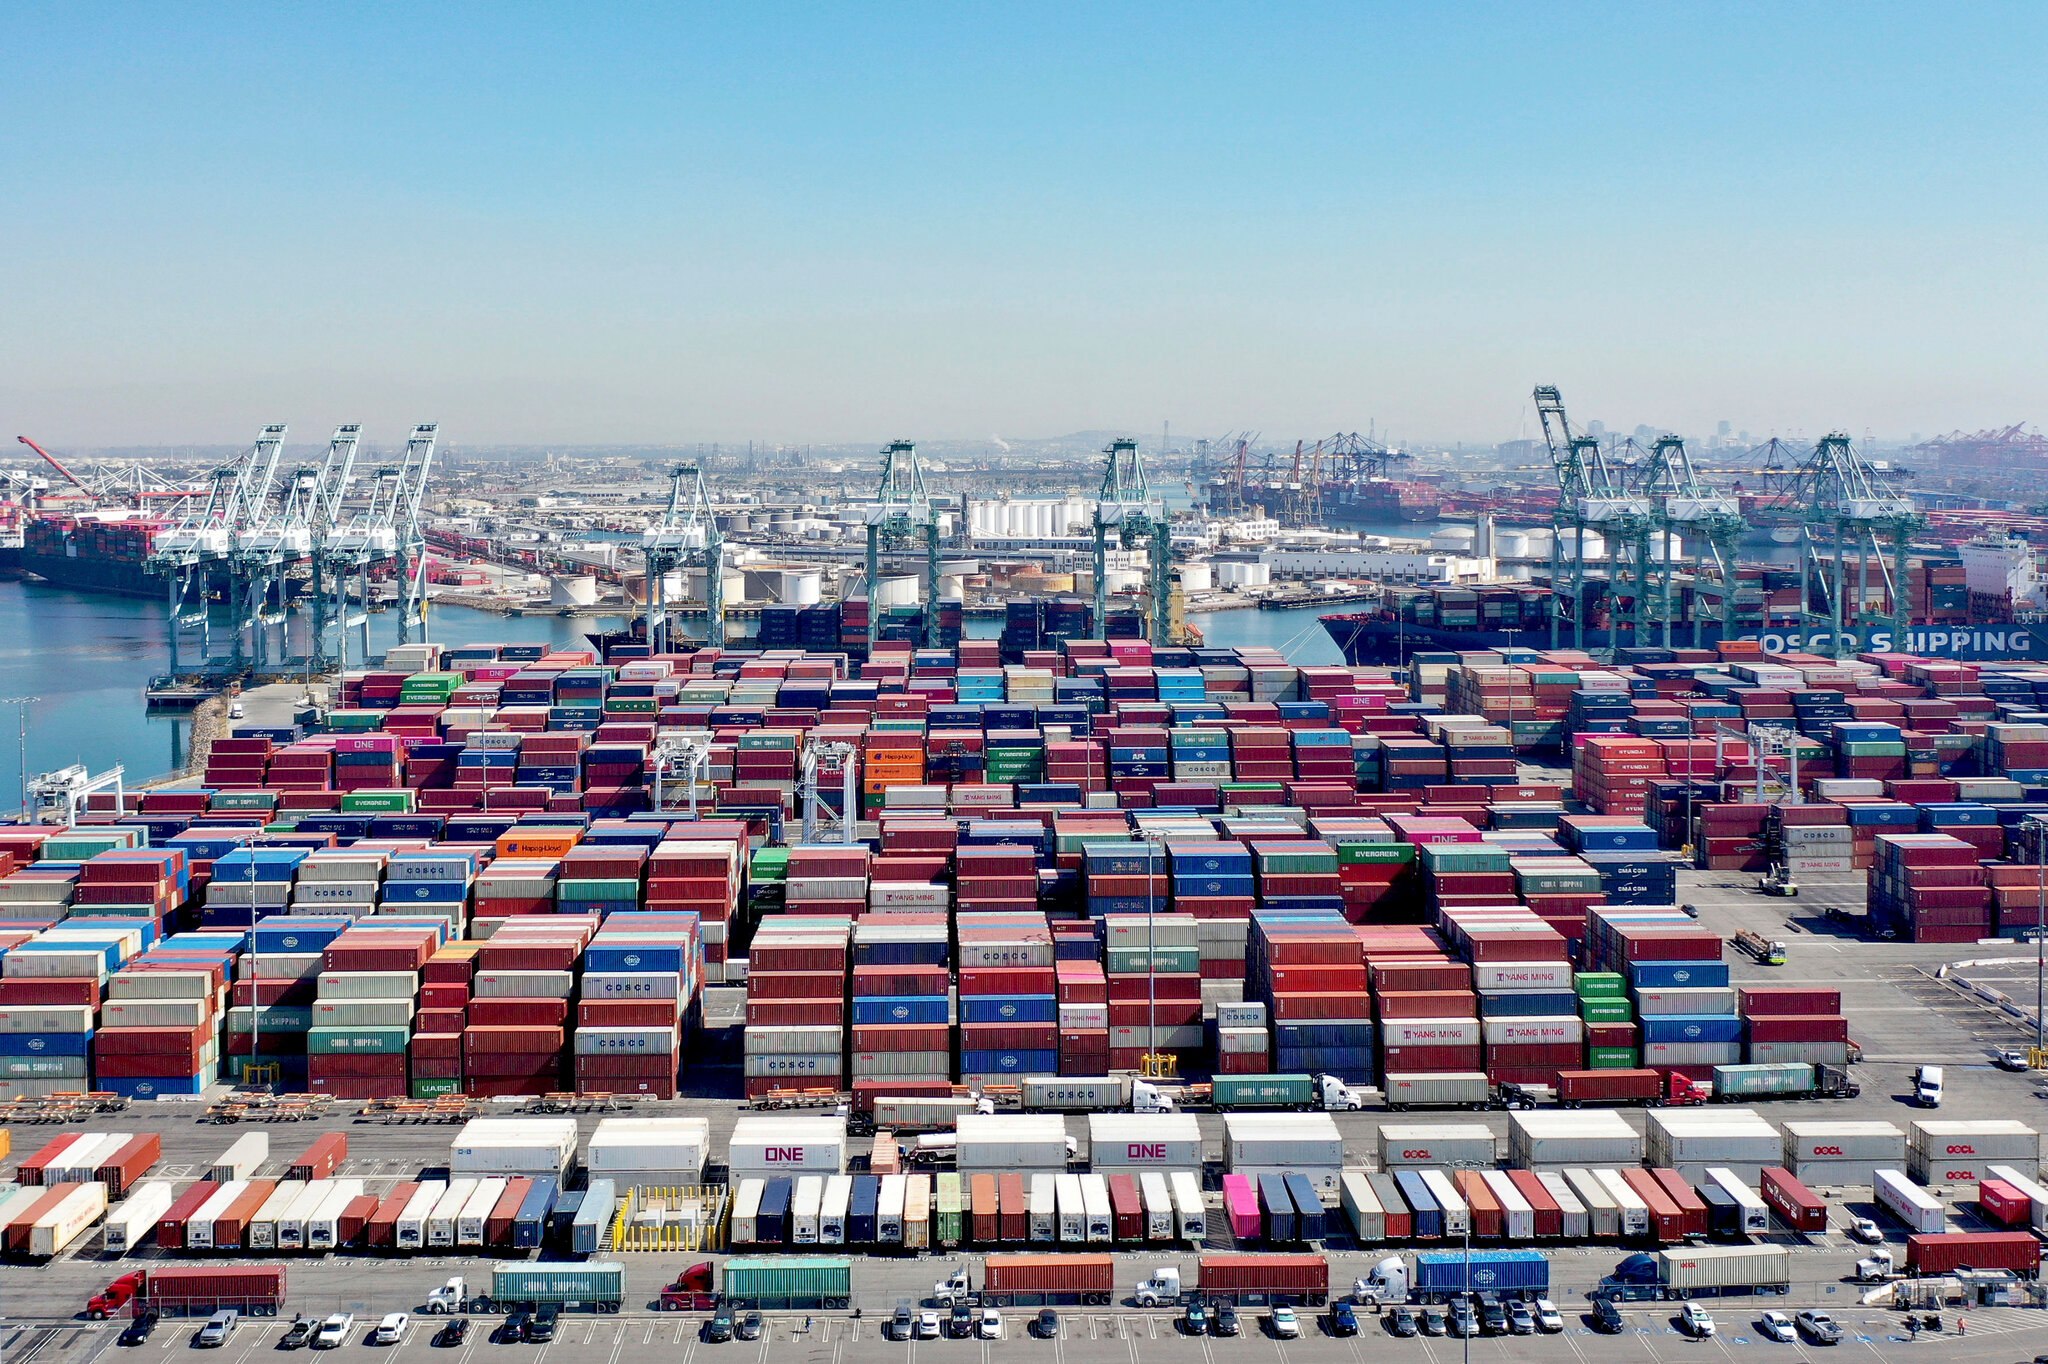
Container Terminal Operators at the Port of Los Angeles are earning higher throughput margins from a 5.7% year-over-year volume surge in April, while drayage truckers absorb unrecoverable fuel cost increases that have risen from $3.53 per gallon at the start of the tracking period to $5.64 per gallon by the week ending May 4. The Port of Los Angeles processed 890,861 Twenty-Foot Equivalent Units (TEUs) in April, 5.7% above last year, marking the second-best April on record. TEU (Twenty-Foot Equivalent Unit) the standard container measurement representing a 20 foot long shipping container measures port throughput capacity. The port moved cargo efficiently with no reported congestion, crediting coordination among longshore workers, terminal operators, trucking, and rail partners, but the underlying margin distribution has shifted dramatically.
On the sell side: terminal operators are capturing increased revenue from higher container volumes without proportional cost increases. April 2026 loaded imports totaled 459,825 TEUs, an increase of 5% compared to last year and 21% higher than March. Terminal handling charges typically range from $300-500 per container, meaning operators generated approximately $4-6 million in additional monthly revenue from the import volume increase alone. Fixed infrastructure costs remain constant while throughput rises, expanding operating margins. On the buy side: drayage truckers the short-haul carriers moving containers between ports and inland distribution centers face a margin compression crisis. A typical 50 mile round trip from Los Angeles port to an inland warehouse consumes approximately 8 gallons of diesel in a loaded truck averaging 6 miles per gallon. At the current $5.64 per gallon, fuel costs alone reach $45 per trip, compared to $28 at the beginning of 2026.
The 60% diesel price increase translates directly into unrecoverable cost pressure because fuel surcharge mechanisms lag spot pricing and cover only a fraction of actual consumption. Standard fuel surcharge tables assume 6.5 miles per gallon and update weekly based on Department of Energy averages, but reefer operations consume an additional 0.08-0.15 per mile in fuel costs that standard FSC tables do not account for, requiring carriers to negotiate reefer fuel premiums on top of standard surcharges. Consider a mid-sized drayage operator running 20 trucks daily from Port of Los Angeles terminals to regional distribution centers. Each truck completes an average of three 50 mile round trips daily, consuming 24 gallons of diesel per truck. At current pricing, daily fuel costs reach $135 per truck, or $2,700 for the fleet. At the January baseline of $3.53 per gallon, the same operation cost $1,694 daily a $1,006 increase that cannot be recovered through existing contract pricing.
For large integrated logistics providers (UPS Supply Chain Solutions, DHL, major third-party logistics operators) with derivatives access: hedging diesel exposure through NYMEX heating oil futures contracts provides partial protection, with contracts typically covering 60-80% of fuel exposure. These operators can also negotiate quarterly fuel adjustment clauses with major shippers that reset based on sustained price movements. For smaller regional drayage operators independent truckers, family-owned fleets, regional cooperatives without derivatives access: practical alternatives include negotiating weekly fuel surcharge adjustments rather than monthly, diversifying pickup locations to minimize deadhead miles, and forming driver cooperatives to achieve bulk fuel purchasing power that can secure 10-15 cent per gallon discounts at truck stops.
For observers: monitor the Freightos Baltic Index FBX01 (China to North America West Coast) route pricing weekly Asia-US West Coast prices rose 8% to $2,127 per FEU in recent data. If container rates continue rising while drayage capacity tightens due to operator margin pressure, the arbitrage shifts from terminals to surviving truckers who can maintain operations. Watch Los Angeles port efficiency statistics through June if terminal velocity slows despite strong import demand, it signals drayage bottlenecks are constraining overall port capacity.

'%3e%3cg id='Final-Copy-2_2_' transform='translate(1275.000000, 200.000000)'%3e%3cpath class='st0' d='M7.4,12.8h6.8l3.1-11.6H7.4C4.2,1.2,1.6,3.8,1.6,7S4.2,12.8,7.4,12.8z'/%3e%3c/g%3e%3c/g%3e%3c/g%3e%3cg id='final---dec.11-2020'%3e%3cg id='_x30_208-our-toggle' transform='translate(-1275.000000, -200.000000)'%3e%3cg id='Final-Copy-2' transform='translate(1275.000000, 200.000000)'%3e%3cpath class='st1' d='M22.6,0H7.4c-3.9,0-7,3.1-7,7s3.1,7,7,7h15.2c3.9,0,7-3.1,7-7S26.4,0,22.6,0z M1.6,7c0-3.2,2.6-5.8,5.8-5.8 h9.9l-3.1,11.6H7.4C4.2,12.8,1.6,10.2,1.6,7z'/%3e%3cpath id='x' class='st2' d='M24.6,4c0.2,0.2,0.2,0.6,0,0.8l0,0L22.5,7l2.2,2.2c0.2,0.2,0.2,0.6,0,0.8c-0.2,0.2-0.6,0.2-0.8,0 l0,0l-2.2-2.2L19.5,10c-0.2,0.2-0.6,0.2-0.8,0c-0.2-0.2-0.2-0.6,0-0.8l0,0L20.8,7l-2.2-2.2c-0.2-0.2-0.2-0.6,0-0.8 c0.2-0.2,0.6-0.2,0.8,0l0,0l2.2,2.2L23.8,4C24,3.8,24.4,3.8,24.6,4z'/%3e%3cpath id='y' class='st3' d='M12.7,4.1c0.2,0.2,0.3,0.6,0.1,0.8l0,0L8.6,9.8C8.5,9.9,8.4,10,8.3,10c-0.2,0.1-0.5,0.1-0.7-0.1l0,0 L5.4,7.7c-0.2-0.2-0.2-0.6,0-0.8c0.2-0.2,0.6-0.2,0.8,0l0,0L8,8.6l3.8-4.5C12,3.9,12.4,3.9,12.7,4.1z'/%3e%3c/g%3e%3c/g%3e%3c/g%3e%3c/g%3e%3c/svg%3e) Privacy Choices
Privacy Choices