.avif)

US crude oil traders operating on 60–90 day physical positions face a margin environment that could shift by $8–12/barrel within a single month the June CPI print gives them a brief window of relative calm that the underlying oil market has already begun to close.
The June CPI report, released 14 July 2026, is the most consequential US inflation print for oil markets since the 2022 energy shock. The headline CPI fell 0.4% month on month the largest monthly decline since the pandemic dislocations of 2020 pulling the year over year rate to 3.5% and the core rate (which strips out food and energy) to 2.6%. The energy index itself dropped 5.7% in June alone, making it the single largest contributor to the monthly decline. That energy relief reads as durable in the CPI data. It is not. The ~25% slide in oil prices that drove it was itself a product of geopolitical de-escalation signals signals that, according to reports, have since reversed amid renewed US-Iran hostilities. The CPI is a rearview mirror. The oil market is already looking through the windshield at a different landscape.
The mechanism linking that CPI print to crude oil trading margins runs through the Federal Reserve's rate path and specifically through SOFR (the Secured Overnight Financing Rate, the benchmark interest rate at which banks lend to each other overnight, which determines the cost of financing physical commodity inventory). When a softer CPI print shifts market expectations toward a slower pace of rate hikes, SOFR forward curves ease. A 25–50 basis point (one basis point equals one-hundredth of a percentage point) downward shift in near-term SOFR expectations reduces the carry cost the financing expense of holding physical inventory over time by approximately $1–3/MT on a standard 90 day position in grain, oilseed, or petroleum products. For crude oil traders with financed long positions that is, traders who own physical oil they have yet to deliver this represents genuine near-term margin relief. The June CPI print opened that window. The question is how long it stays open.
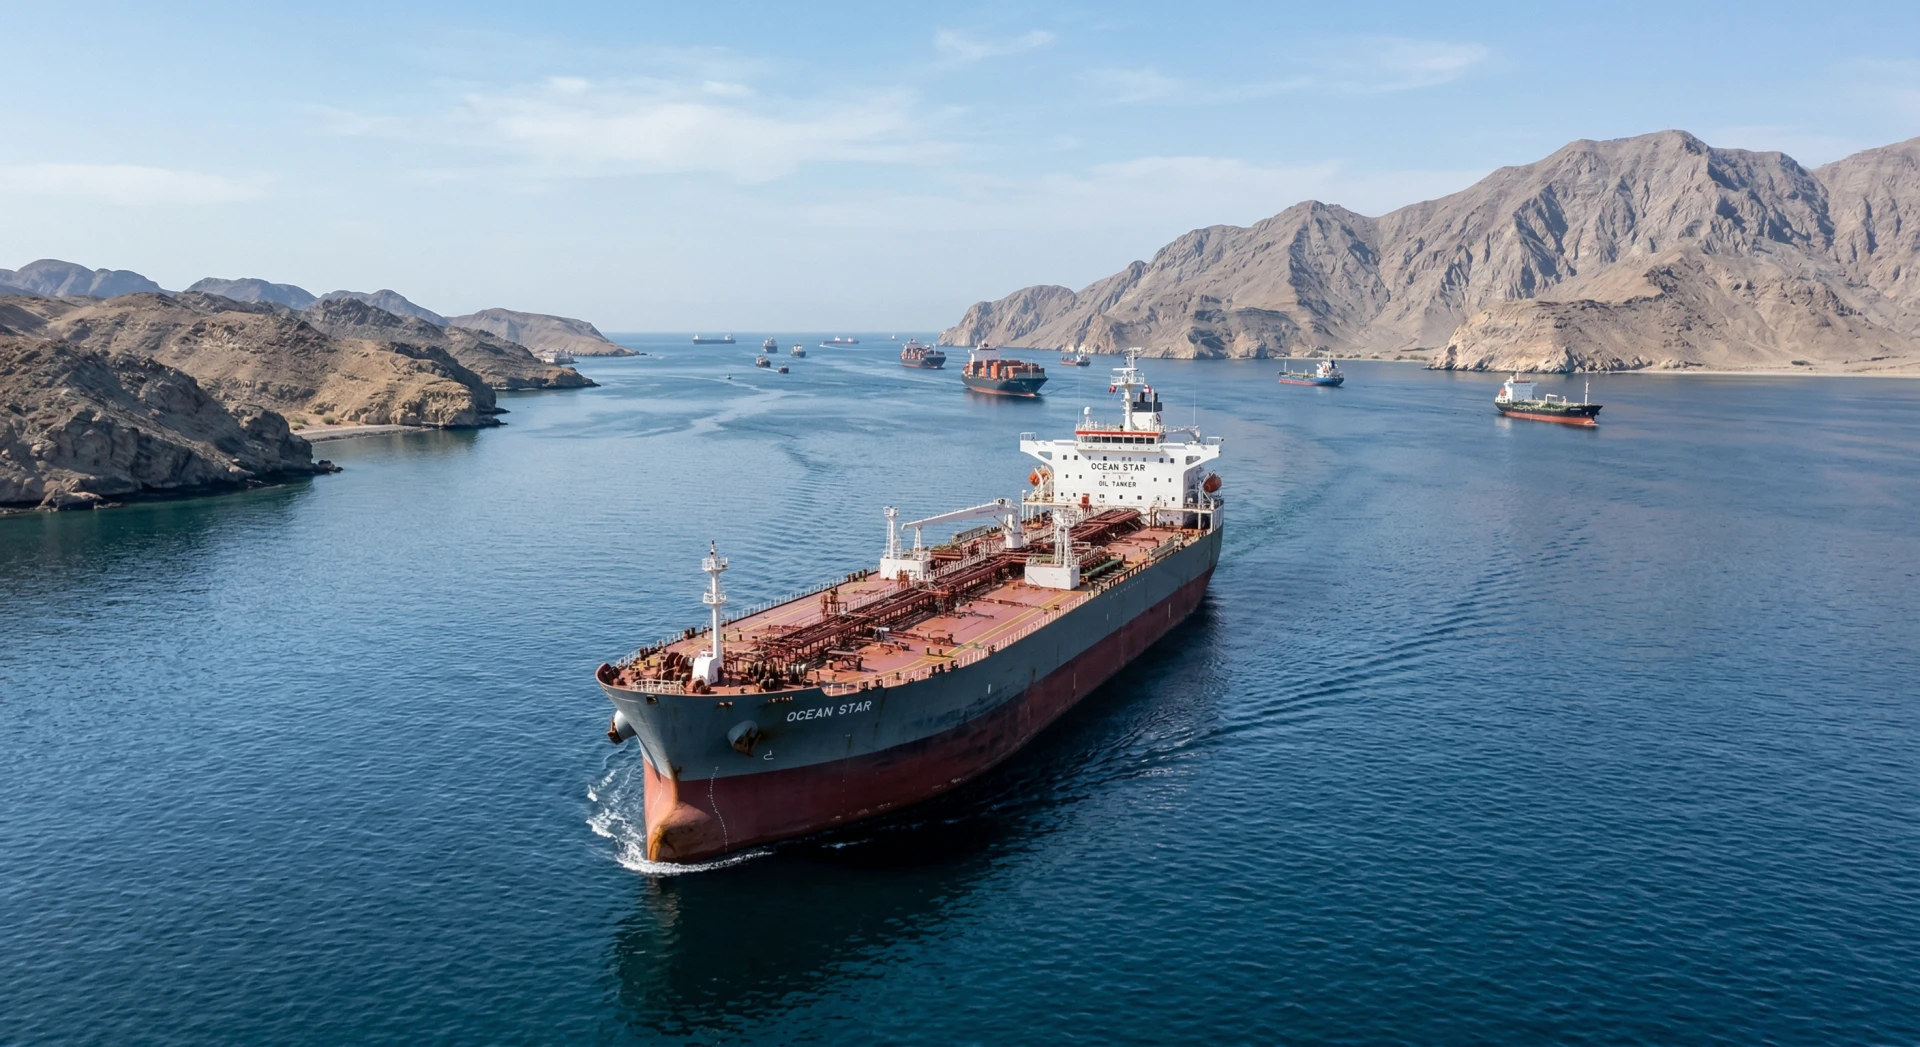
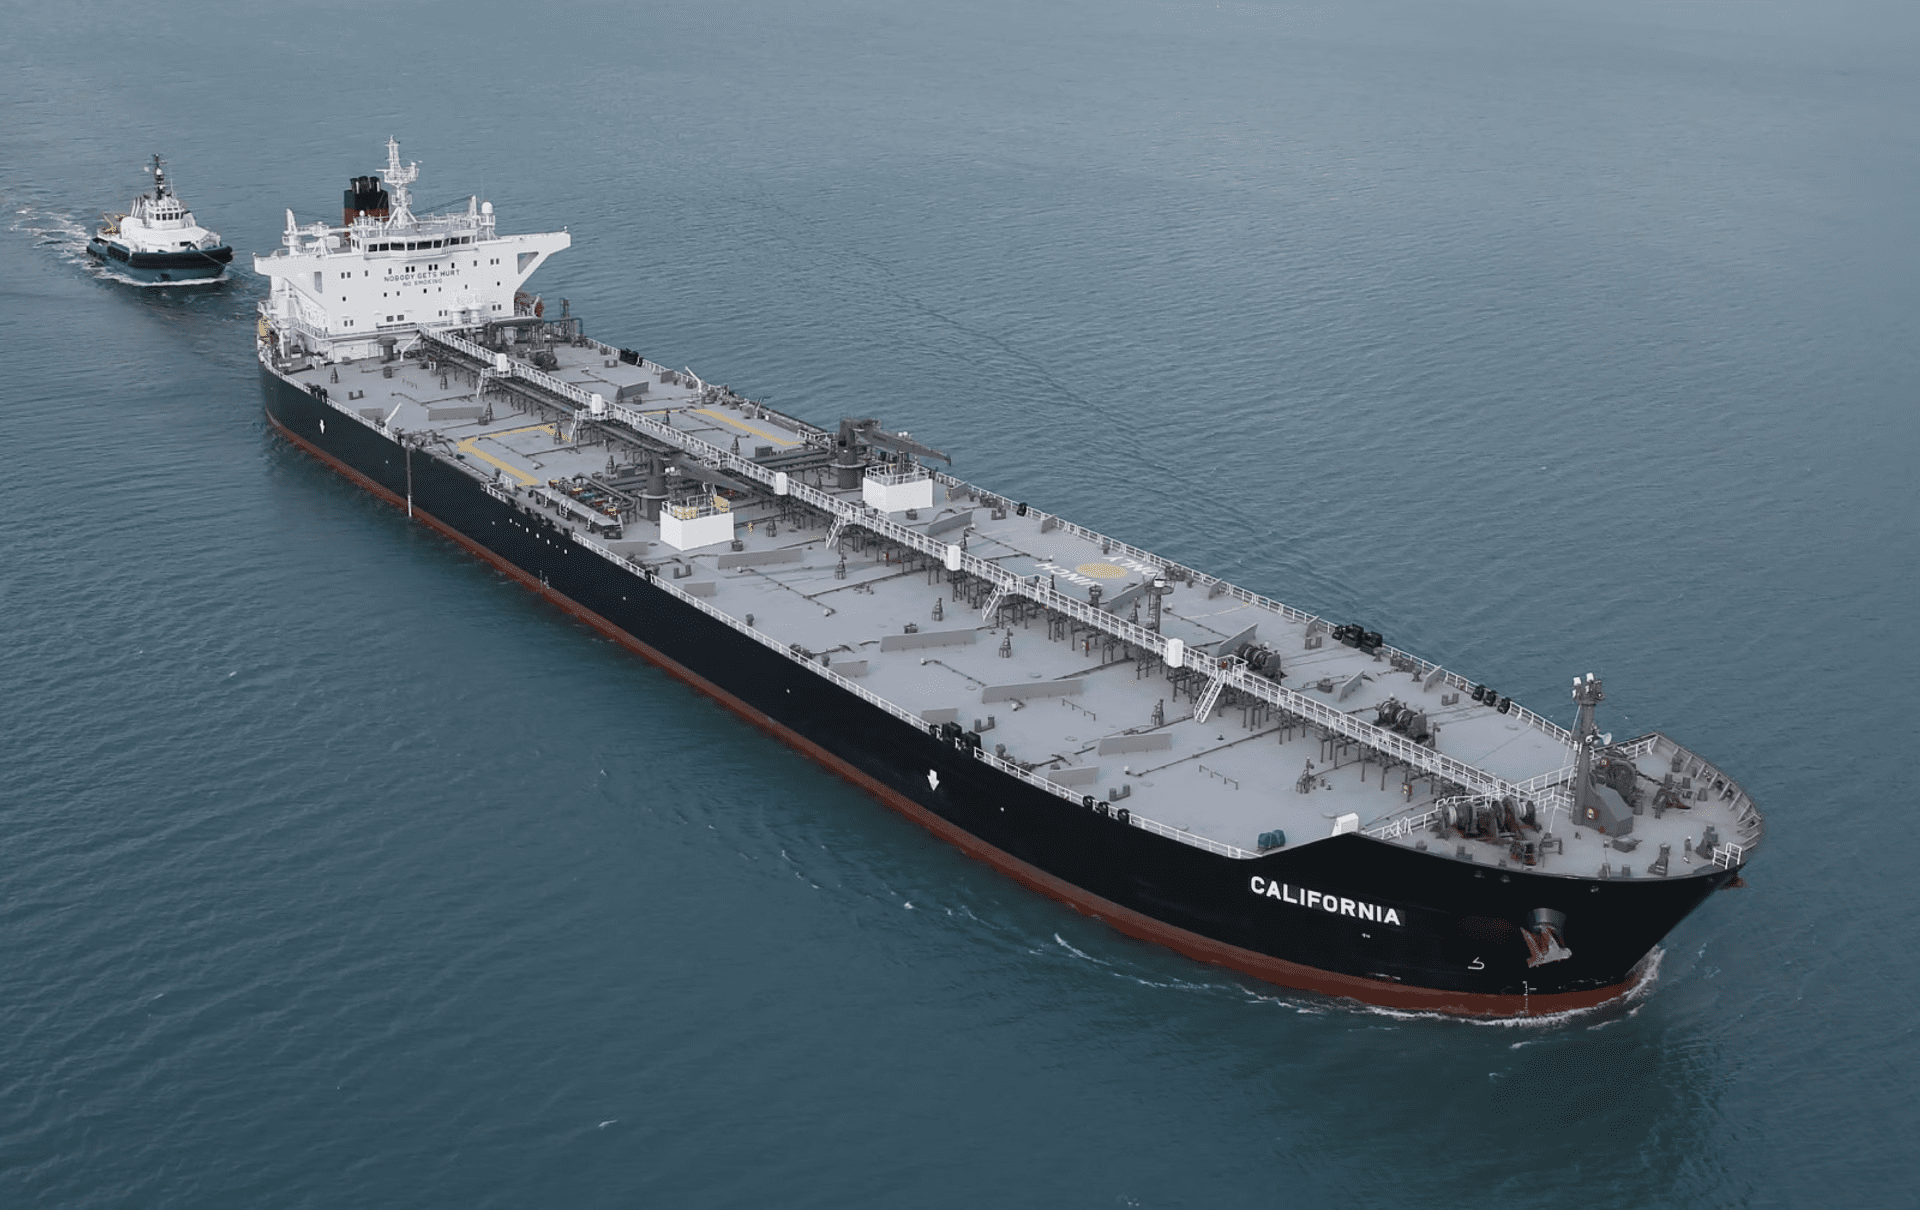
The freight dimension of this story concentrates risk in a specific chokepoint. The Strait of Hormuz is the fulcrum of the current geopolitical risk. A VLCC (Very Large Crude Carrier, a supertanker capable of carrying 2 million barrels, or approximately 270,000 tonnes of crude) transiting the Strait from Abu Dhabi's Jebel Ali terminal to a Japanese refinery typically covers the voyage in 20–25 days. If, according to reports, US-Iran tensions were to force a sustained Hormuz disruption, Middle East crude destined for Asia and Europe would increasingly reroute via the Cape of Good Hope adding 10–15 days of steaming time and $1.5–3.0/MT in additional freight costs. At current VLCC rates, that rerouting adds $405,000–$810,000 to the cost of a single cargo. That cost does not disappear it transfers to whoever does not control the freight contract. The party that owns the freight owns the margin compression.
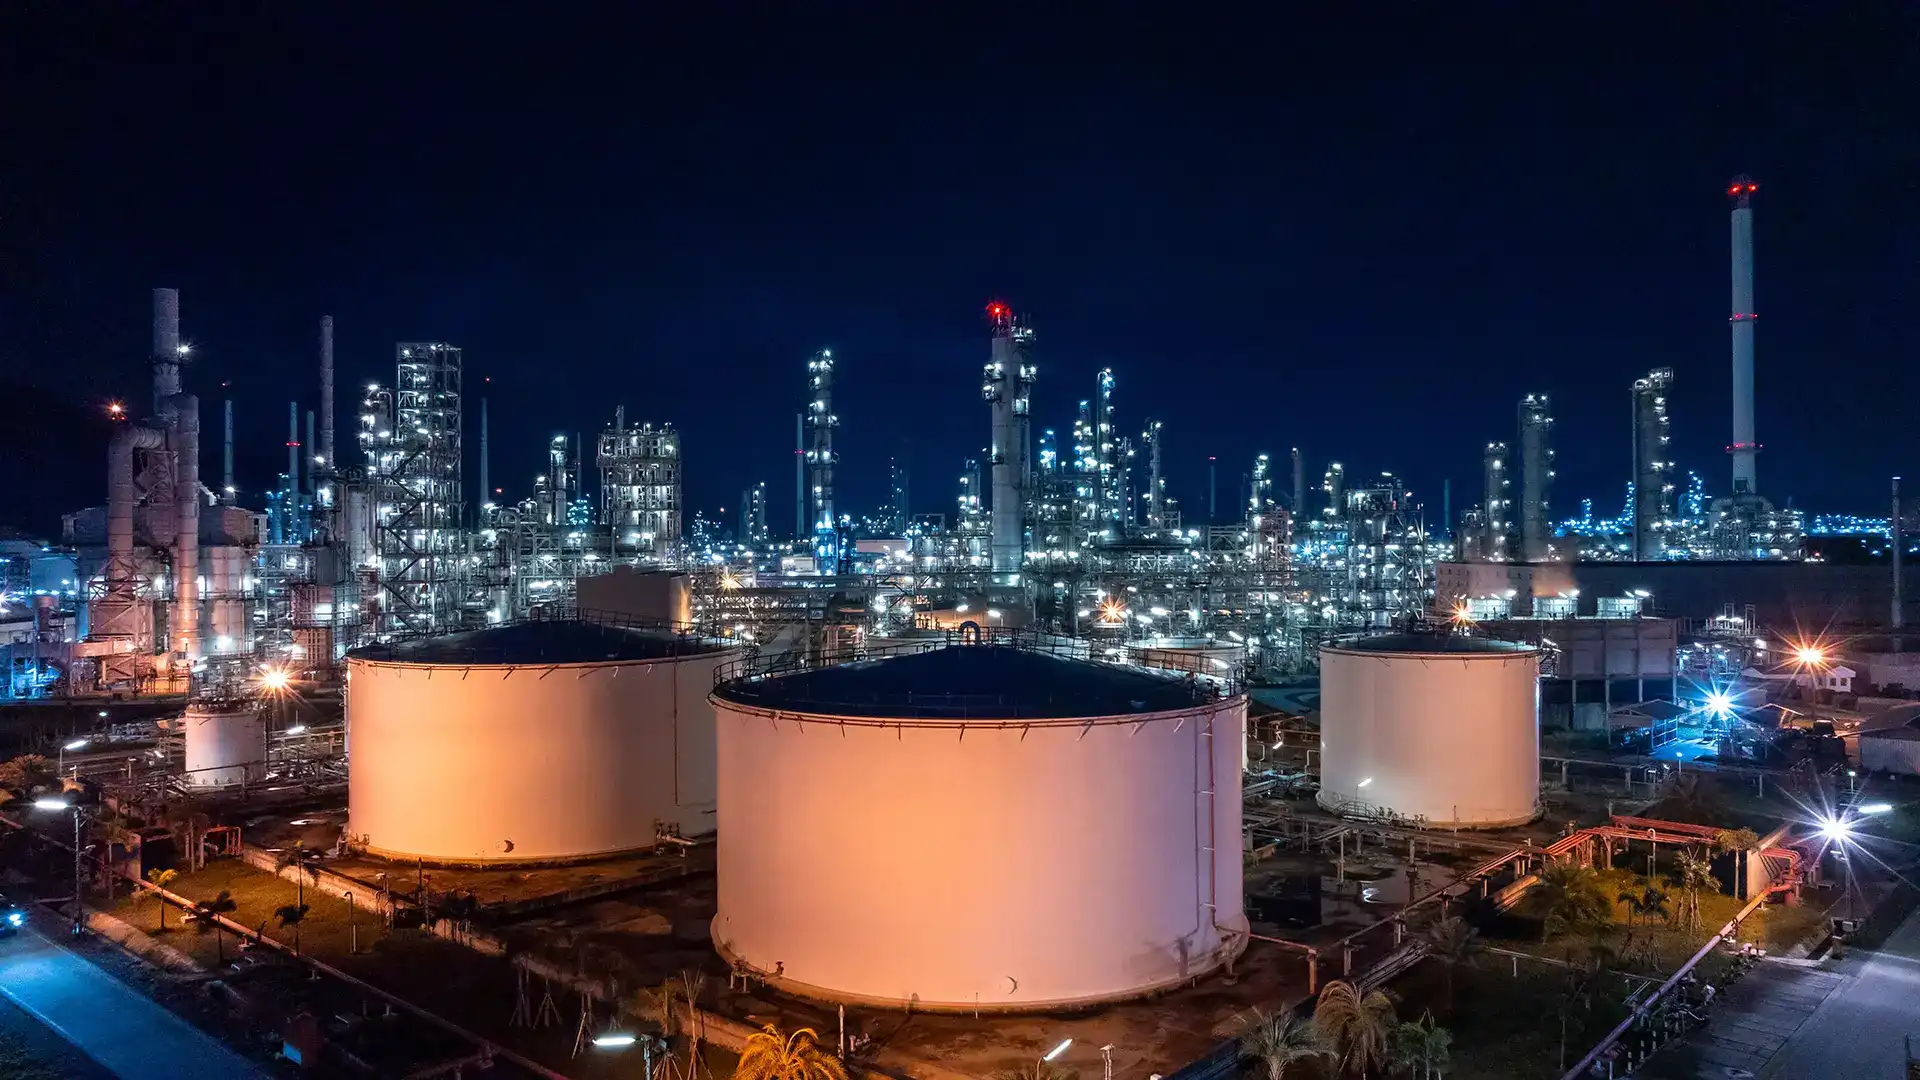
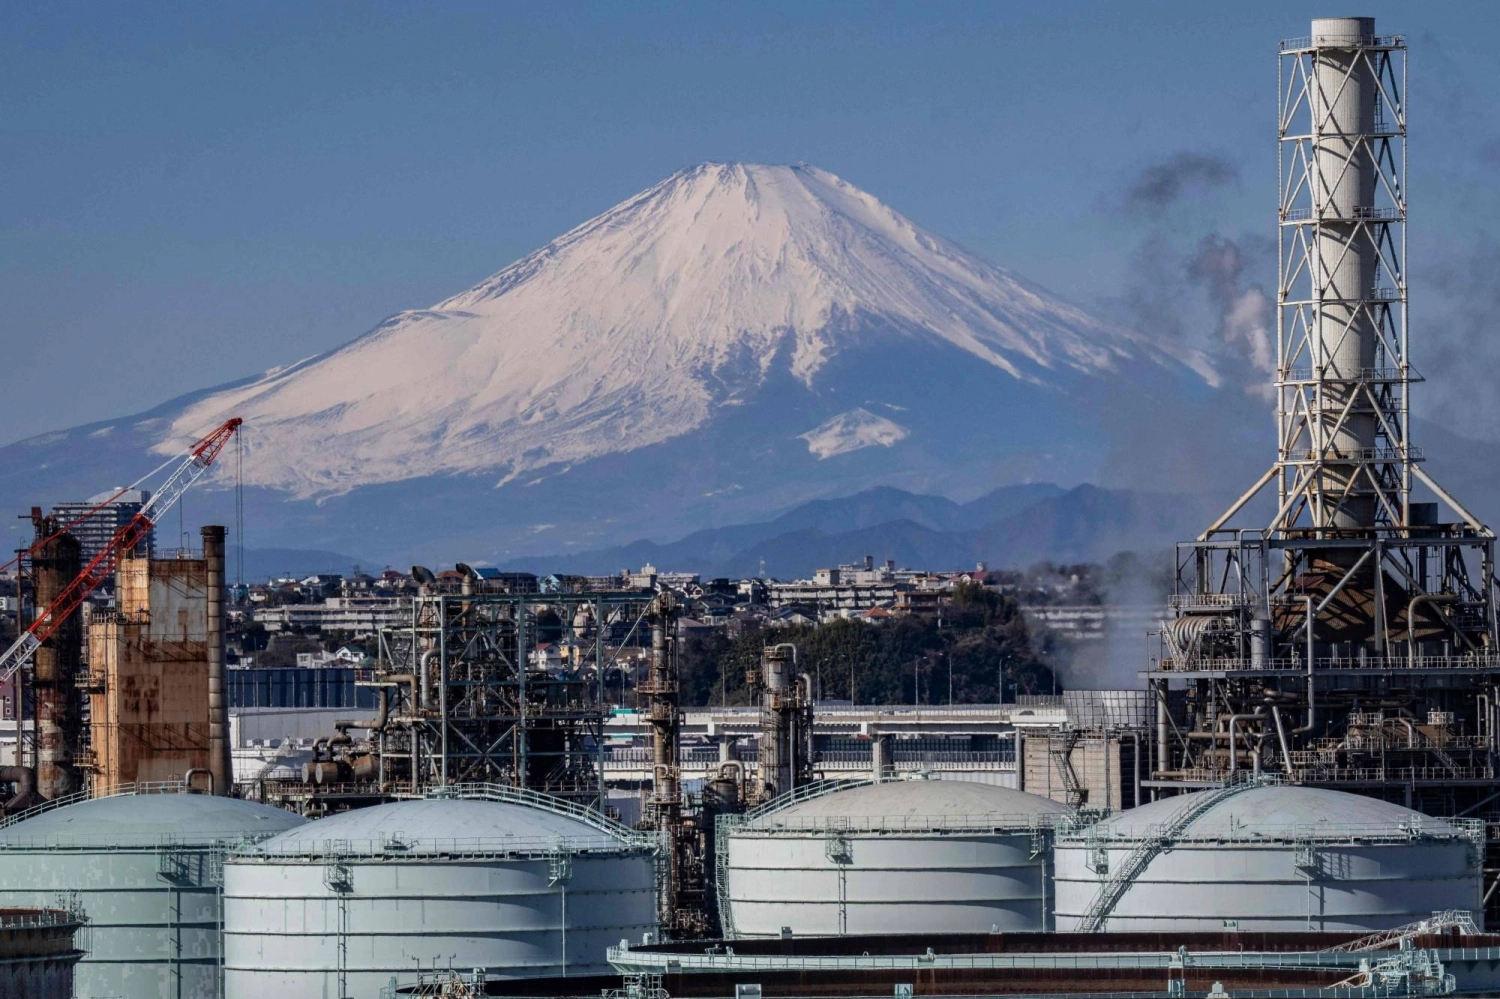
Consider the margin anatomy of a US refiner in this environment. On the buy side, a mid-sized US Gulf Coast refiner processing 150,000 barrels per day is currently benefiting from the June oil price weakness crude acquisition costs fell sharply, and the June CPI relief has temporarily suppressed the urgency of further Fed tightening, keeping dollar-denominated crude relatively accessible. But on the sell side, the picture is more exposed. RBOB gasoline the reformulated blended gasoline blend used in US retail markets faces demand resistance above $3.20/gallon at the pump. If crude recovers $5–10/barrel on Hormuz risk premium, while retail gasoline prices face a consumer ceiling, the crack spread (the difference between the price of crude oil and the price of refined products, which represents the refinery's gross processing margin) compresses by an estimated $3–6/barrel. On a 150,000 barrel per day throughput, a $4/barrel crack spread compression costs that refiner approximately $600,000 per day in gross margin. A two-week escalation scenario costs $8.4 million before operating adjustments.
The dollar's role in this story is often underappreciated and currently material. A dovish CPI read one that signals the Fed may pause or slow rate hikes typically weakens the US dollar index (DXY), which measures the dollar against a basket of major currencies. A weaker dollar makes dollar priced commodities cheaper for foreign buyers, which temporarily boosts demand for US-origin exports and shifts the competitive landscape in agricultural commodity markets. In the 2–4 weeks following a significant CPI undershoot, Brazilian soy and Argentine corn become relatively more expensive in dollar terms for Asian buyers, creating a brief arbitrage window where US origin competes more effectively. For crude oil specifically, a softer DXY translates into slightly higher realized prices for non-US producers selling in dollars which may partially offset the geopolitical discount already being applied to Gulf crude. Traders positioned across both commodity classes should model this DXY sensitivity explicitly; it is a second-order effect that disappears within a month but is real during its window.
For large integrated traders the Trafiguras, Vitols, and national oil company trading arms of this world the actionable instrument here is a combination of calendar spread positioning and freight derivatives. A calendar spread a simultaneous long position in near-term crude and short position in forward-month crude captures backwardation (the market structure where near-term prices are higher than forward prices, signalling physical scarcity now rather than later) if Hormuz risk reintroduces supply tightness. Freight derivatives on the Middle East–Asia VLCC route (TD3C) allow the same operators to hedge against the Cape of Good Hope rerouting cost. The cost of a 30 day TD3C hedge at current implied volatility is approximately $0.80–1.20/MT a rounding error relative to the $1.5–3.0/MT freight cost exposure it covers. For smaller regional operators independent fuel importers, mid-sized distributors without derivatives access the practical equivalent is fixing price terms bilaterally with suppliers now, before a Hormuz escalation re-prices spot supply, and building 15–20 days of additional inventory buffer beyond seasonal norms.
The structural reality that the June CPI obscures is worth naming directly. US gasoline retail prices, while lower year on year, remain elevated by refinery capacity constraints and the RVP (Reid Vapour Pressure a regulatory limit on petrol volatility that requires refiners to produce a more expensive summer grade fuel blend) compliance calendar, which restricts supply flexibility during peak driving season. The energy CPI relief, in other words, overstates the consumer purchasing power recovery. Households are paying less than they were at the June 2025 peak, but the structural floor under gasoline prices is higher than the headline number implies. This matters for the Fed's reaction function: Governor Christopher Waller's warning against overreacting to the June print is well grounded precisely because the commodity-driven CPI improvement could be erased within a single 30 day Hormuz incident. The Fed's stated preference for a measured approach keeping rate hikes on the table without committing to a trigger is the correct posture given this fragility.
The specific signal to watch, with a defined time window, is the ICE Brent 1-month/3-month calendar spread combined with weekly EIA (US Energy Information Administration) crude inventory data, through 15 August 2026. If the spread moves from contango (forward prices higher than near-term indicating ample supply) into backwardation by more than $0.50/barrel while EIA inventories draw more than 3 million barrels in any single week, the geopolitical risk premium is translating into physical tightness, not just sentiment. That combination not the CPI print alone, and not geopolitical headlines alone is the operational trigger for procurement teams and traders to reposition. A single data point from either series is noise. Convergence between them, within this window, is signal.

.jpg)

'%3e%3cg id='Final-Copy-2_2_' transform='translate(1275.000000, 200.000000)'%3e%3cpath class='st0' d='M7.4,12.8h6.8l3.1-11.6H7.4C4.2,1.2,1.6,3.8,1.6,7S4.2,12.8,7.4,12.8z'/%3e%3c/g%3e%3c/g%3e%3c/g%3e%3cg id='final---dec.11-2020'%3e%3cg id='_x30_208-our-toggle' transform='translate(-1275.000000, -200.000000)'%3e%3cg id='Final-Copy-2' transform='translate(1275.000000, 200.000000)'%3e%3cpath class='st1' d='M22.6,0H7.4c-3.9,0-7,3.1-7,7s3.1,7,7,7h15.2c3.9,0,7-3.1,7-7S26.4,0,22.6,0z M1.6,7c0-3.2,2.6-5.8,5.8-5.8 h9.9l-3.1,11.6H7.4C4.2,12.8,1.6,10.2,1.6,7z'/%3e%3cpath id='x' class='st2' d='M24.6,4c0.2,0.2,0.2,0.6,0,0.8l0,0L22.5,7l2.2,2.2c0.2,0.2,0.2,0.6,0,0.8c-0.2,0.2-0.6,0.2-0.8,0 l0,0l-2.2-2.2L19.5,10c-0.2,0.2-0.6,0.2-0.8,0c-0.2-0.2-0.2-0.6,0-0.8l0,0L20.8,7l-2.2-2.2c-0.2-0.2-0.2-0.6,0-0.8 c0.2-0.2,0.6-0.2,0.8,0l0,0l2.2,2.2L23.8,4C24,3.8,24.4,3.8,24.6,4z'/%3e%3cpath id='y' class='st3' d='M12.7,4.1c0.2,0.2,0.3,0.6,0.1,0.8l0,0L8.6,9.8C8.5,9.9,8.4,10,8.3,10c-0.2,0.1-0.5,0.1-0.7-0.1l0,0 L5.4,7.7c-0.2-0.2-0.2-0.6,0-0.8c0.2-0.2,0.6-0.2,0.8,0l0,0L8,8.6l3.8-4.5C12,3.9,12.4,3.9,12.7,4.1z'/%3e%3c/g%3e%3c/g%3e%3c/g%3e%3c/g%3e%3c/svg%3e) Privacy Choices
Privacy Choices