.avif)
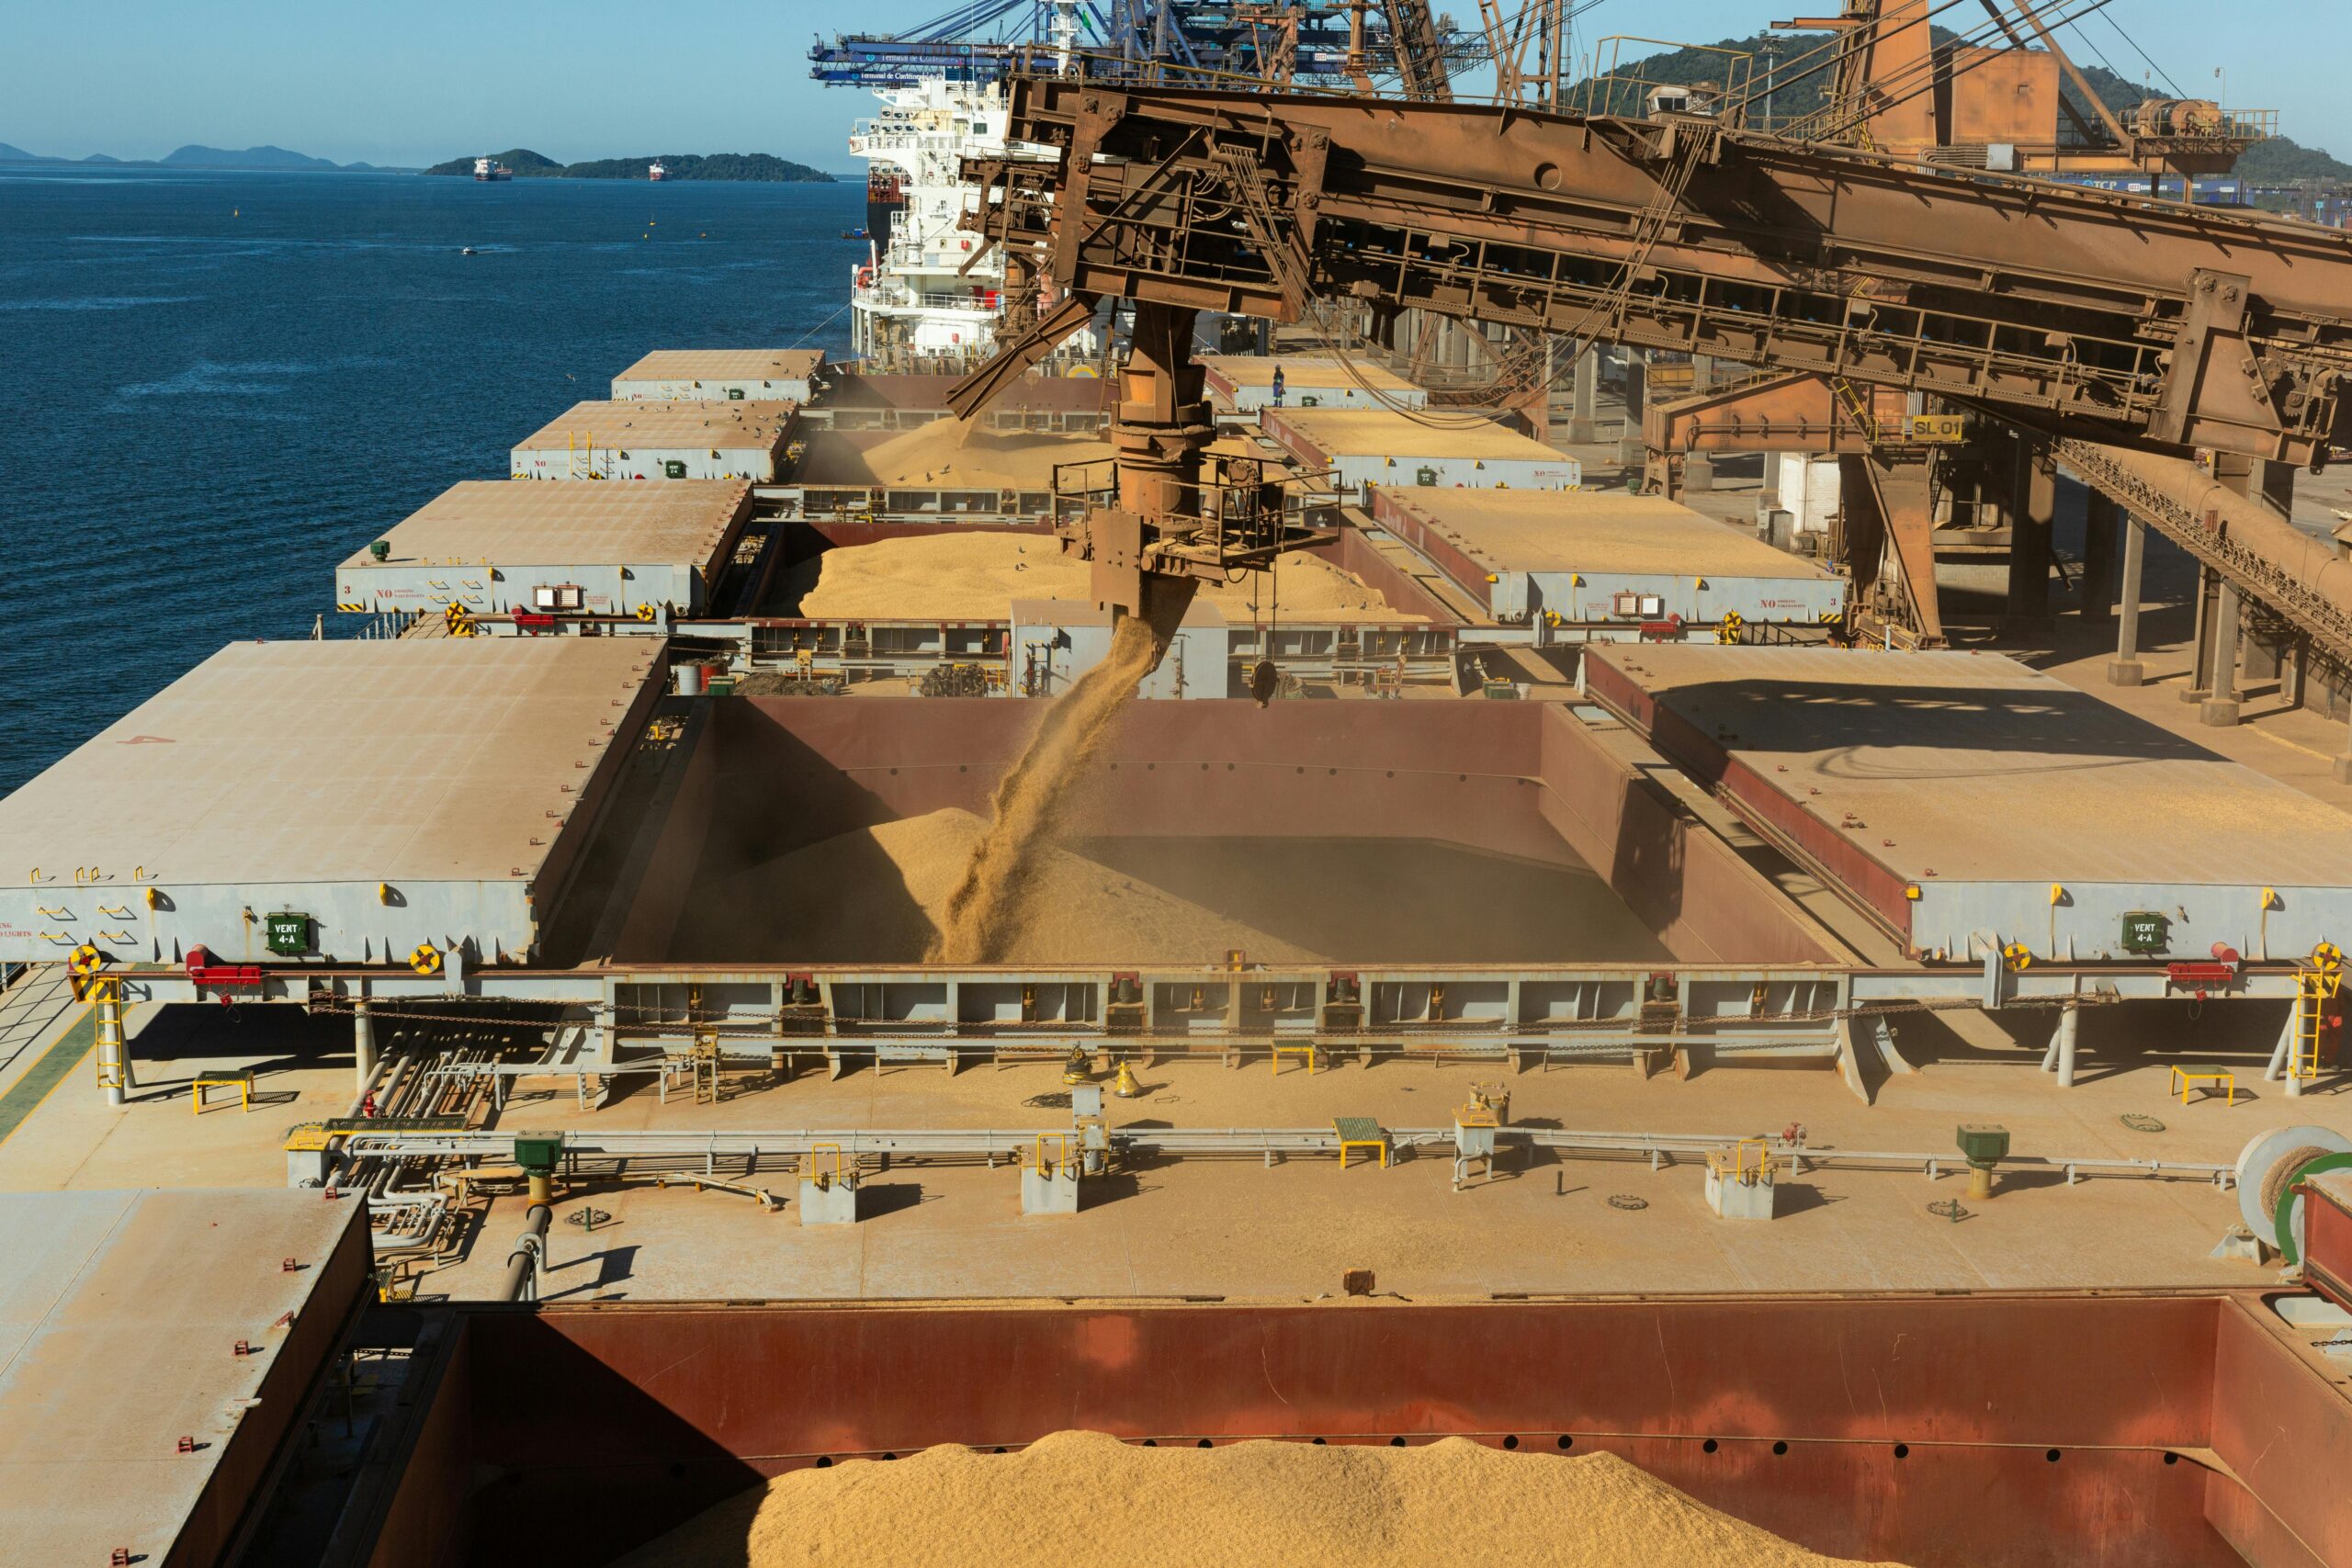
Global grain exporters face their strongest pricing environment in three years as the FAO's monthly food index edged down just 0.2% in May to 130.8 points effectively flat despite headwinds. The FAO Food Price Index, which tracks monthly changes in the international prices of a basket of globally traded food commodities, averaged 130.8 points in May 2026, down 0.2 percent from its revised April level and 2.9 percent higher than its year earlier level. The index a weighted average of prices for cereals, vegetable oils, dairy, meat, and sugar masks significant underlying strength in grain markets that benefits exporters with harvest capacity. World wheat prices rose 3.4 percent on the month and 7.8 percent from their year earlier level supported by smaller expected harvests in major exporters, including the United States of America, where winter wheat crop conditions are among the least favourable in decades. Consider a mid-sized grain exporter shipping a 50,000 tonne wheat cargo from the U.S. Gulf to Egypt: at current CBOT levels around $5.85/bushel ($215/MT), versus $5.40/bushel at year start, that cargo now delivers an additional $1.25 million in revenue. The margin expansion is real, immediate, and accelerating.
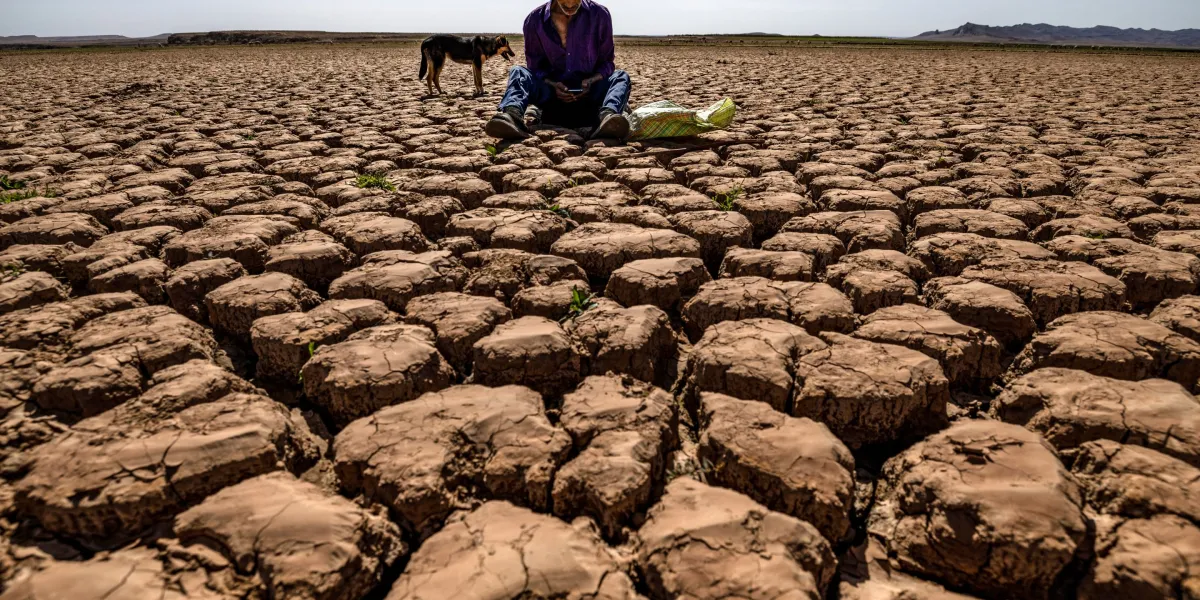
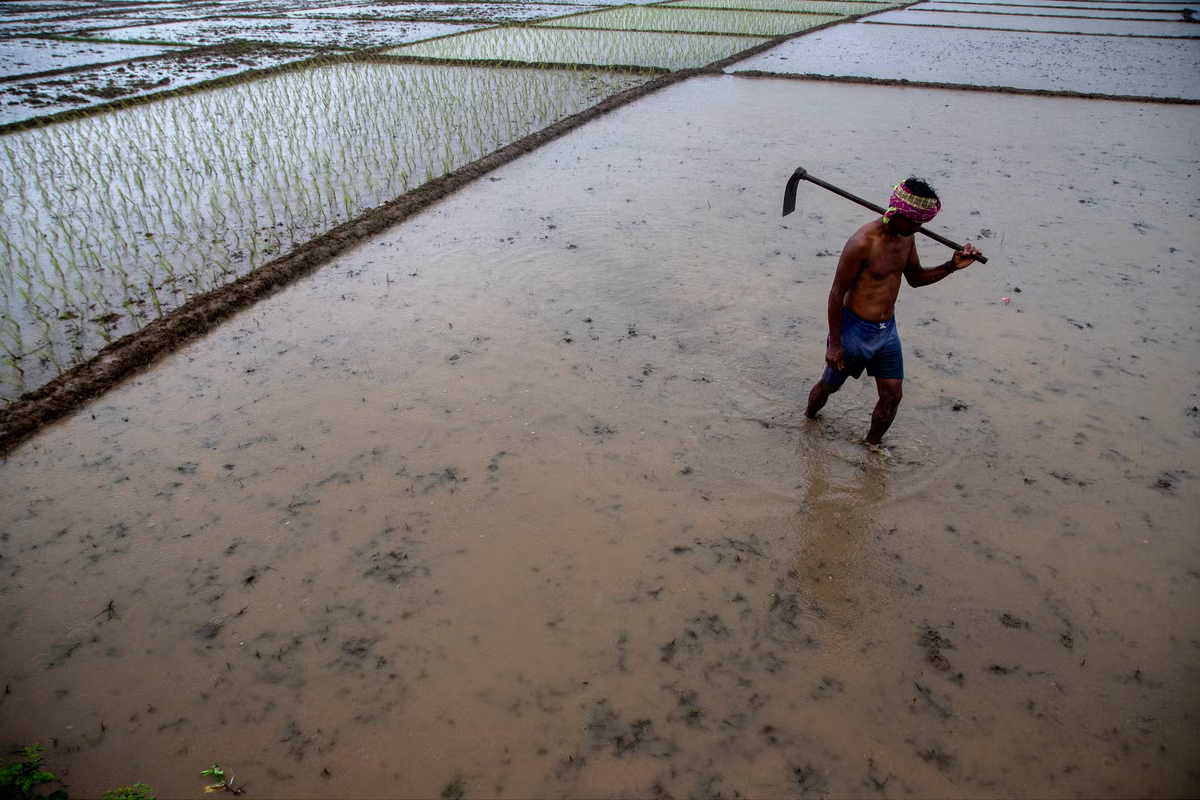
The FAO Cereal Price Index increased by 2.6 percent from April and was nearly 5.0 percent higher than a year ago, reflecting higher prices across all major cereals amid higher fuel and fertilizer costs globally and weather related pressures. Wheat has climbed for four consecutive months, with futures rising from under $5.40/bushel in January to over $5.80/bushel by June. USDA shocked the grain trade in early May when it forecast the 2026-27 overall winter wheat harvest at 1.048 billion bushels, down 25% from the 2025-26 crop and the smallest since 1965. Corn prices gained 1.9% month on month, supported by firmer import demand and tighter supplies in Brazil and the United States. Maize prices rose 1.9 percent 3.9 percent annualized on the back of stronger import demand in key markets, tighter availability in Brazil and the United States and firmer energy prices that boosted ethanol related demand. Rice followed suit with a 2.7% increase amid weather concerns in Asia. The underlying driver is structural: global cereal production is forecast to decline roughly 2% year on year to 2.98 billion tonnes in 2026/27, down from record levels in 2025.
For large integrated grain traders Cargill, ADM, Bunge the opportunity lies in capturing both physical premiums and financial positioning. The projected 2026/27 season average farm price is $6.50 per bushel, up $1.50 from last year on a lower stocks to use ratio and a higher projected U.S. corn price. At CBOT wheat futures around $5.85/bushel for July delivery versus $4.90/bushel basis last July, the calendar spread reflects genuine scarcity premiums rather than speculative positioning. These operators can hedge forward sales at current elevated levels while maintaining flexibility through options strategies. The risk premium in wheat options implied volatility near 25% versus historical averages around 18% creates additional revenue opportunities for sophisticated players with derivatives access. Ending stocks in the U.S. for 2026-27 are forecast to fall to 762 million bushels (mb) as a result, compared to pre-report estimates of 833 mb, last year's current projection of 935 mb and 2024-25 ending stocks of 855 mb. The stocks to use ratio tightening provides fundamental support beyond weather premiums.
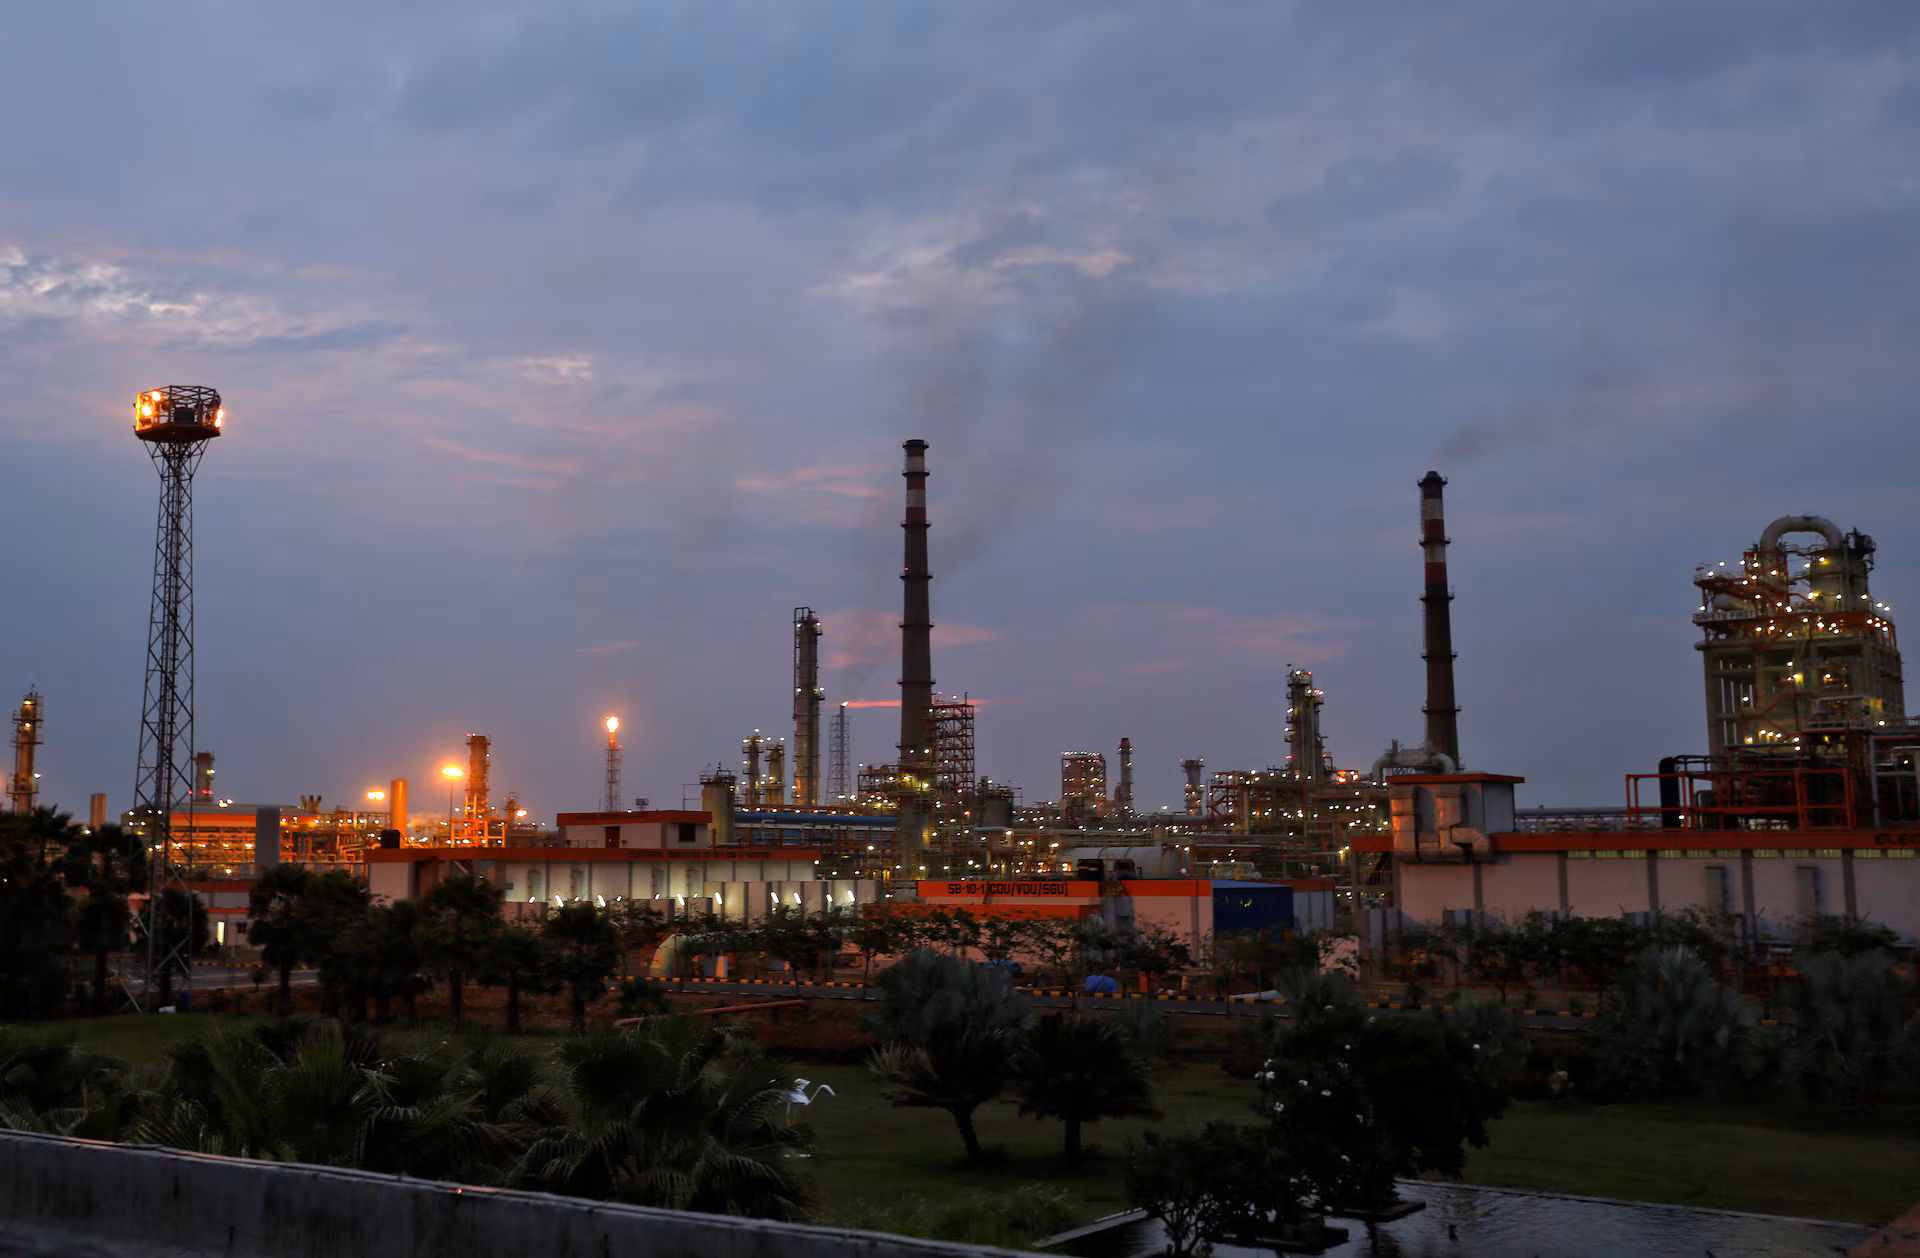
For smaller regional grain elevators and farm cooperatives without derivatives access, the strategy shifts to timing and logistics optimization. A typical 500,000 bushel country elevator can capture an additional $75,000 in gross margin by moving wheat sales forward from traditional post-harvest timing to current elevated levels if storage capacity allows. The key constraint is fertilizer costs: Continued uncertainty affecting key trade routes, including the Strait of Hormuz, could reduce fertilizer use and place additional pressure on food prices, highlighting the need for coordinated international action. Input cost inflation averaging 15-20% across nitrogen, phosphorus, and potash means next season's production economics favor those who can lock fertilizer pricing now while capturing current grain price premiums. Regional operators should focus on multi-year supply agreements with fertilizer suppliers to hedge input cost volatility while maximizing current selling opportunities. The practical hedge for smaller players is inventory management: selling current crop grain at premiums while contracting next crop fertilizer at fixed prices.
Watch the USDA's June 30 Acreage Report for confirmation that high input costs are driving substitution away from fertilizer-intensive crops toward soybeans and other alternatives. Based on current forecasts, world cereal stocks are predicted to contract slightly, by 0.3 percent, due mostly to lower anticipated rice inventories, leaving the global cereal stock to use ratio, at 31.7 percent, close to its earlier level. If confirmed, the structural shift toward lower input crops will tighten grain supplies beyond current weather-driven concerns. The Chicago Board of Trade September wheat futures curve currently in $0.15/bushel backwardation relative to December signals immediate physical tightness that should persist through the 2026 harvest. Exporters positioned to capitalize on current premiums while hedging input cost exposure face the strongest fundamental environment since 2008-2011. The opportunity window narrows with every passing month as Northern Hemisphere harvest approaches, but early indicators suggest this premium environment extends well into 2027.


.webp)
'%3e%3cg id='Final-Copy-2_2_' transform='translate(1275.000000, 200.000000)'%3e%3cpath class='st0' d='M7.4,12.8h6.8l3.1-11.6H7.4C4.2,1.2,1.6,3.8,1.6,7S4.2,12.8,7.4,12.8z'/%3e%3c/g%3e%3c/g%3e%3c/g%3e%3cg id='final---dec.11-2020'%3e%3cg id='_x30_208-our-toggle' transform='translate(-1275.000000, -200.000000)'%3e%3cg id='Final-Copy-2' transform='translate(1275.000000, 200.000000)'%3e%3cpath class='st1' d='M22.6,0H7.4c-3.9,0-7,3.1-7,7s3.1,7,7,7h15.2c3.9,0,7-3.1,7-7S26.4,0,22.6,0z M1.6,7c0-3.2,2.6-5.8,5.8-5.8 h9.9l-3.1,11.6H7.4C4.2,12.8,1.6,10.2,1.6,7z'/%3e%3cpath id='x' class='st2' d='M24.6,4c0.2,0.2,0.2,0.6,0,0.8l0,0L22.5,7l2.2,2.2c0.2,0.2,0.2,0.6,0,0.8c-0.2,0.2-0.6,0.2-0.8,0 l0,0l-2.2-2.2L19.5,10c-0.2,0.2-0.6,0.2-0.8,0c-0.2-0.2-0.2-0.6,0-0.8l0,0L20.8,7l-2.2-2.2c-0.2-0.2-0.2-0.6,0-0.8 c0.2-0.2,0.6-0.2,0.8,0l0,0l2.2,2.2L23.8,4C24,3.8,24.4,3.8,24.6,4z'/%3e%3cpath id='y' class='st3' d='M12.7,4.1c0.2,0.2,0.3,0.6,0.1,0.8l0,0L8.6,9.8C8.5,9.9,8.4,10,8.3,10c-0.2,0.1-0.5,0.1-0.7-0.1l0,0 L5.4,7.7c-0.2-0.2-0.2-0.6,0-0.8c0.2-0.2,0.6-0.2,0.8,0l0,0L8,8.6l3.8-4.5C12,3.9,12.4,3.9,12.7,4.1z'/%3e%3c/g%3e%3c/g%3e%3c/g%3e%3c/g%3e%3c/svg%3e) Privacy Choices
Privacy Choices